Table of Contents
The cheapest uniform quote often creates the most expensive program. Procurement managers frequently treat workwear as a simple commodity, negotiating a rock-bottom price per piece. However, uniforms are an indirect procurement category that quietly leaks budget through poor controls. When you optimize for the fabric instead of the friction, your total cost of ownership multiplies.
A comprehensive uniform cost analysis is a financial evaluation framework that measures the initial garment price alongside ordering friction, replacement cycles, inventory handling, compliance risk, and offboarding loss.
Having audited end-to-end garment lifecycles for global enterprises, I see this financial leakage firsthand. Departing employees who fail to return issued garments cost companies roughly £65 to £175 per person in unrecovered apparel value, a metric heavily scrutinized in ISO 55000 asset management standards.
We see this cross-industry pattern daily. A luxury hotel group bleeds money replacing split seams. A hospital network loses thousands tracking missing antimicrobial scrubs. A regional airline delays a massive rollout due to unpredictable sizing errors.
This guide provides a proven framework for evaluating uniform program ROI. We cover the basics, core concepts, key benefits, and implementation challenges.
How to Model Uniform Cost Analysis
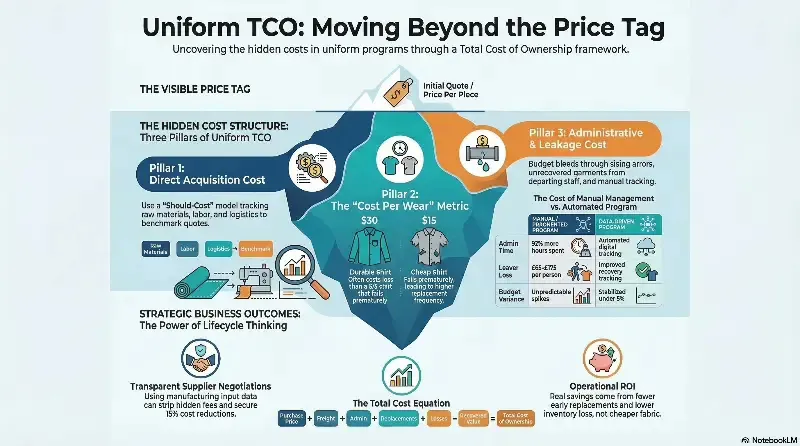
When we analyze corporate workwear programs, we rarely find a simple transaction. Instead, we see a continuous operational loop. To understand how your budget flows from purchase to disposal, we use a specific architectural framework.
Here is exactly how to run a complete uniform cost analysis using three distinct pillars.
Pillar 1: Direct Acquisition Cost
The first layer represents the cash you spend to move the physical garment into your warehouse. Procurement teams often treat supplier quotes as a complete mystery. We strip this down using a Should-Cost model.
We never just accept the final price tag. We trace the mechanical inputs. First, we calculate the raw materials. We measure fabric weight (like a 250 GSM canvas), chemical finishes, and trims. Next, we factor in the labor. We calculate the cut-make-trim (CMT) process, seam construction complexity, and embroidery time. Finally, we map the logistics. We add ocean freight, import duties, regional distribution, and kitting.
Mapping these inputs removes the guesswork. A should-cost model helps you objectively benchmark supplier quotes against global apparel costing standards. A factory quote audit then rebuilds that benchmark line by line, showing exactly where you pay for quality and where you pay for middleman markup.
Pillar 2: Lifecycle and Usage Cost
https://www.youtube.com/watch?v=sEFszwBOGlE
Once the garment hits the floor, the cost clock keeps ticking. We constantly see identical-looking shirts yield completely different workwear lifecycle cost profiles.
A garment’s lifespan depends entirely on the physical environment. We track the garment replacement frequency based on three factors. First, we log wear frequency. Second, we measure washing intensity. Third, we track physical failure points like blown knees, busted zippers, or faded collars.
To evaluate this accurately, we use a strict metric: Cost per wear = Total garment cost / expected number of compliant wears. We constantly see identical-looking shirts yield completely different workwear lifecycle cost profiles based on this equation.
Different industries trigger different failure points. Aviation crews require exact batch color matching to maintain front-of-house consistency. Healthcare environments demand high-temperature laundering cycles to meet hygiene standards. These harsh chemicals degrade cheap fibers rapidly. Hospitality staff need stretch fabrics to survive grueling 10-hour shifts.
If you buy a $15 shirt that fails after 30 washes, it costs significantly more over 24 months than a $30 shirt built to commercial laundering durability standards that survives 100 washes. A higher upfront cost generates a drastically lower operating cost.
Pillar 3: Administrative and Leakage Cost
Here is where most enterprise budgets bleed out. When we audit supply chains, we trace the administrative friction required to keep the program running.
We look directly at the hidden operational costs. These include sizing errors, site-by-site ordering fragmentation, and heavy inventory carrying costs. You also lose massive value through leaver recovery failures. This happens when staff quit and keep the gear. We also find “ghost” accounts that remain active for former employees.
Managing these variables manually requires massive human effort. Industry data shows that manual uniform tracking takes up to 92% more administrative time than automated digital systems. We watch managers waste hours reconciling invoices and handling messy exchanges. For example, if you source high-visibility gear from a safety vest manufacturer but lose 40% of the inventory to disorganized spreadsheets, your safety investment instantly evaporates.
The Total Cost Equation

To visualize your true spend, combine these three pillars into one functional equation. Whether you manage an industrial plant or source from school uniform manufacturers, use this formula:
Uniform Program TCO = Initial purchase cost + freight/duty + admin time + warehousing + replacements + losses/non-returns + exchanges/returns + compliance overhead (minus) recoveries/resale/redeployment
Because this administrative load is so heavy, buyers generally compare three operating models to manage the chaos:
- Self-Managed Purchase Model: You buy bulk and manage all distribution internally.
- Managed Uniform Portal: You give employees a digital allowance to order directly from the vendor.
- Hybrid Program: You combine central corporate controls with individual employee ordering and delivery.
🔄 Process Loop: By modeling these three pillars, you transform a messy purchasing chore into a controllable business system.
The Strategic Value of Rigorous Uniform Cost Analysis

When evaluating vendors or management systems, ignore brochure claims. Base your decisions on strict Total Cost of Ownership (TCO) criteria. A rigorous uniform cost analysis translates raw data into undeniable business outcomes.
Secures Corporate Apparel Budgets
Multi-year forecasting replaces blind annual purchasing. We helped a national client model exact onboarding demand, expected replacements, and leaver loss. They stopped guessing their annual buy volume. This stabilized their budget variance to under 5% instantly. According to Gartner research on procurement digitization, data-driven forecasting prevents expensive emergency stockouts.
Forces Transparent Supplier Negotiations
Procurement spend analysis unpacks exact manufacturing inputs. It empowers you to challenge padded quotes immediately. I recently used should-cost logic to confront a vendor about fragmented freight assumptions and unclear surcharges. We stripped out hidden fees and secured a 15% cost reduction. Demand this pricing transparency when evaluating industrial uniform manufacturers.
Multiplies Uniform Program ROI
Generate true savings from operational efficiency instead of cheaper fabric. Stop bleeding cash on lost inventory. Our team calculates program ROI using a strict logic block:
- Costs avoided through fewer early replacements.
- Time saved on daily administration.
- Lower loss from improved recovery tracking.
- Fewer premium-priced emergency orders.
📈 ROI Check: Track your annual replacement spend against your new-hire volume. If replacements vastly outpace onboarding, your garments are failing prematurely.
The Limitations of Uniform Cost Analysis
Be candid: no total cost of ownership (TCO) model is perfect. When conducting a uniform cost analysis, we routinely encounter messy real-world data. Building a defensible business case requires acknowledging these gaps rather than ignoring them.
Fragmented Data and Inventory Blind Spots
In our enterprise audits, we consistently find incomplete data regarding garment issues, returns, and replacement histories. Multiple vendors use inconsistent SKU formats and pricing structures. Furthermore, procurement teams rarely know exactly which employee holds what inventory. We frequently see buyers build inaccurate models because they rely entirely on supplier quotes instead of internal should-cost benchmarking. Watch out for vendor proposals that highlight vague “savings” without defining the exact cost buckets.
Hidden Administrative and Software Costs

Procurement teams routinely underestimate the administrative hours and compliance effort required to run these programs. Upgrading to a digital uniform portal carries hidden expenses. When we transition clients to automated systems, we map out steep implementation and change-management costs. The Society for Human Resource Management warns that poor software adoption rates directly derail new technology ROI. Do not ignore the human cost of software rollouts.
Final thought
Organizations that model replacement rates, leakage, and administrative effort usually find that their biggest savings were hidden outside the purchase order. As automated digital tracking becomes the global standard over the next 12 months, companies relying on manual spreadsheets will face harsh budget overruns.
Do you need help evaluating your current supply chain? Contact our team today to take control of your uniform program.

Leave a Comment
Your email address will not be published. Required fields are marked *