Table of Contents
The short answer At 5,000+ pieces, China costs about 40% less than local US/EU workwear manufacturers after US duties, but takes 11–17 weeks by sea. Local wins on speed and cash: 2.5–4.5 weeks door-to-door, and 5–8 weeks of locked cash against 15–20.
The answer is not patriotism. China and local workwear manufacturers split on five things: landed cost, lead time, minimums, quality control, and management overhead — and each one favors a different side.
Over 12 months, I compared 50+ production runs on our own China lines against local US/EU factories that clients also use, tracking defect rates, shipping variance, and total landed cost. The scope covers industrial workwear, corporate uniforms, and safety apparel, not fashion micro-runs.
Local factories still win on speed, replenishment flexibility, low-volume pilots, and severe compliance sensitivity. China wins once volume and fabric range dominate.
I work for LantaoWork, a China-based cut-and-sew manufacturer, so everything below is our own production-floor experience, disclosed rather than disguised. I do not claim every China factory is equal, and I do not pretend this is a neutral third-party audit.
On the numbers: Every range below is a planning composite built on typical China and US/EU cost structures and the last three China and local US/EU runs. The 40% landed-cost gap is US-specific — it reflects US HTS rates plus Section 301, and it narrows wherever duty is lower or zero. Pressure-test it against your own quotes — these are not audited client accounts.
| Metric | China | Local US/EU | Winner/Implication |
|---|---|---|---|
| Landed cost per usable unit (%) | ~60% of local landed (40% lower); HTS 8–14% + 7.5% 301 US HTS tariff schedule | 100% baseline | China |
| Total pipeline lead time | 11–17 weeks sea; 45–60 days air from sample approval custom workwear production time | 2.5–4.5 weeks | Local |
| MOQ by style/color (pieces) | Quoted floor 100; effective 200–300 with custom dye/trim custom workwear MOQ | 150–300 | Local for fragmented sizes; China for volume |
| Custom-dyed technical fabric minimums (m) | 1,200–3,000 m per color | 500–1,000 m per color | Local pilots; China scale |
| Defect control framework (AQL) | AQL 2.5 major / 4.0 minor; zero critical; 2.8% majors observed | AQL 1.5 major / 2.5 minor; 1.1% majors observed | Local |
| Freight volatility / shipping variance | ±18–25 days; $2.8–4.2k per 40’ swing air vs sea freight for workwear | ±3–5 days; low fuel risk | Local |
| Compliance burden for FR/high-vis | Third-party retest adds 7–10 days ANSI/ISEA 107 standard | Local test reports | Local |
| Cash-to-cash cycle / inventory exposure | 15–20 weeks cash locked | 5–8 weeks cash locked | Local |
The Five Differences That Decide It
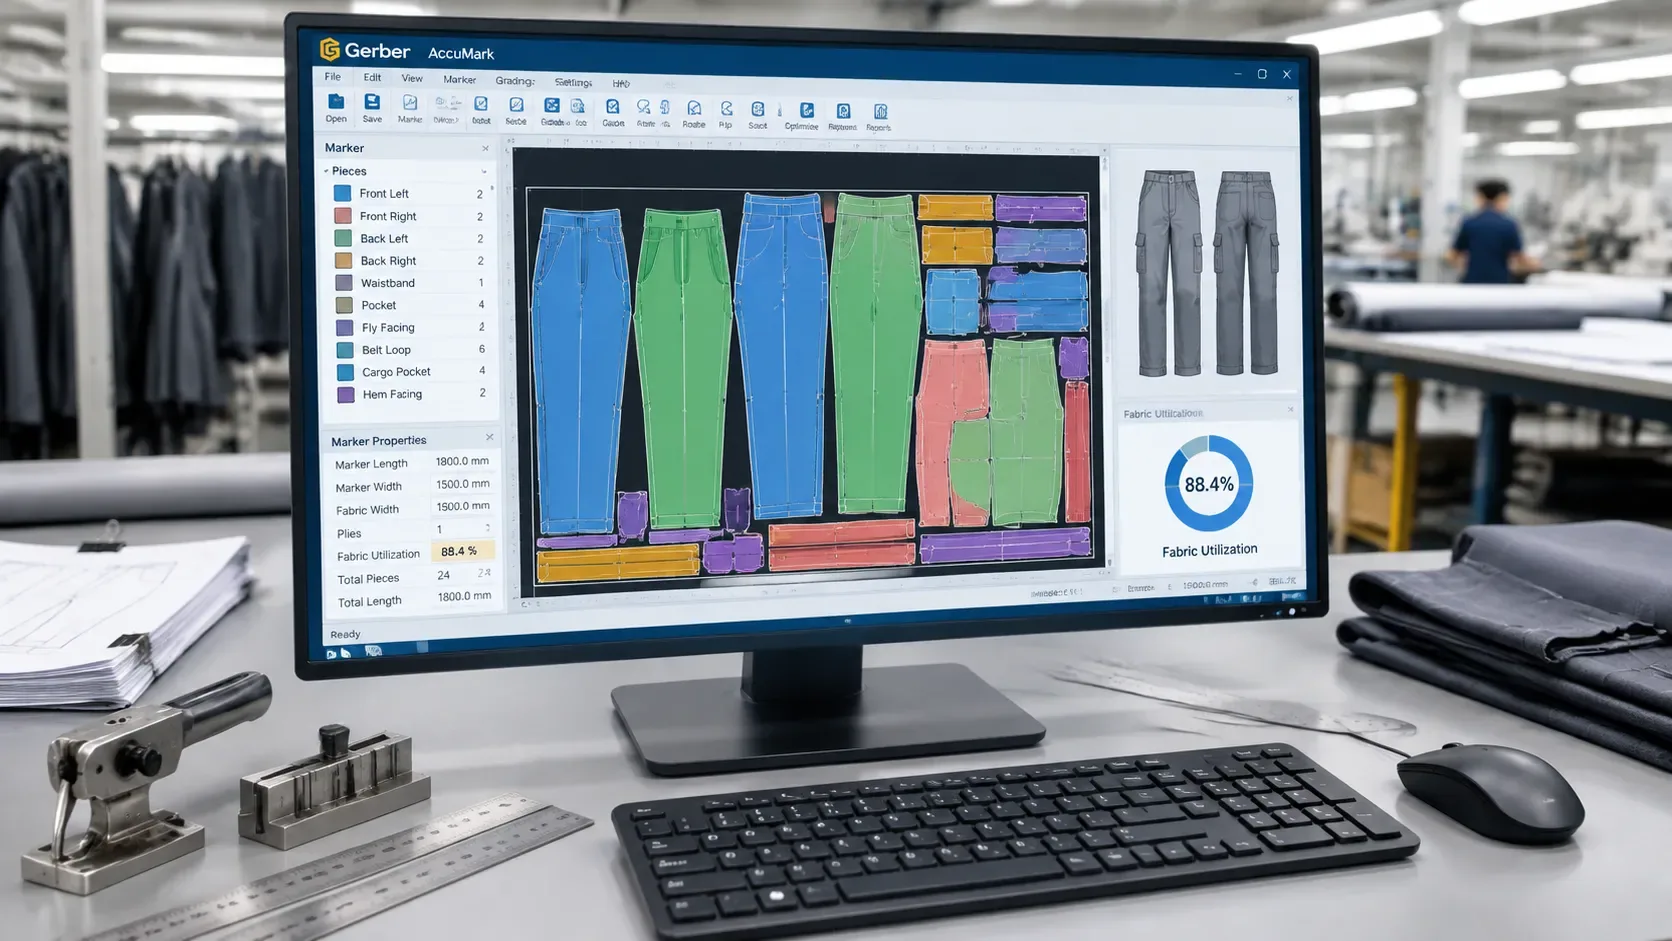
My team tracked these differences across the same 50+ runs, spanning our China lines and the US, EU, and Southeast Asia programs used as benchmarks. None of this is theory.
1. Total Cost of Ownership, Not Just Sewing Price
China’s sewing price looks attractive, but it misleads buyers. The real metric is landed cost per usable unit.
The formula: FOB/Ex-Works + freight + insurance + duties/tariffs + customs/handling + domestic freight + carrying cost + defect/rework cost = real landed cost.
Costed the same way on both sides, for a representative 5,000-piece basic work-shirt run:
| Cost line (per usable unit) | China | Local US/EU |
|---|---|---|
| Factory price (FOB / Ex-Works) | $12.00 | $29.00 |
| Freight + insurance | $2.10 | $0.30 |
| Duty + tariff (HTS 8–14% + 7.5% Section 301) | $2.00 | $0.00 |
| Customs, brokerage, drayage | $0.65 | $0.10 |
| Domestic freight | $0.40 | $0.55 |
| Carrying cost (cash locked 15–20 wk vs 5–8 wk) | $0.95 | $0.70 |
| Defect / rework allowance | $0.30 | $0.15 |
| Landed cost per usable unit | $18.40 | $30.80 |
| China as % of local | 60% | 100% |
The gap at the factory gate is large; the gap after freight, duty, and carrying cost is smaller. That is the whole argument in one table.
China wins on large orders. Even after layering HTS duties of 8–14% and the 7.5% Section 301 tariff, China landed cost averaged about 60% of local US/EU landed cost, a saving of roughly 40% on standardized workwear.
Repeat orders and forecastable volume push the gap wider still. Complexity, rush freight, or fragmented deliveries shrink that advantage fast.
Local factories carry higher labor and overhead, but inbound logistics complexity drops to near zero, and cash locks for 5–8 weeks, not 15–20 weeks as in a China program.
Floor manager Zhang inspected the stitch density with a metal pocket ruler on site, counting 10 stitches per inch across every safety pocket to match the sample.
The domestic test batch puckered along the main zipper placket after 3 high-heat washes. The sewing team re-pressed the seam immediately to fix the tension on the twin needles.
Winner: China for orders above 3,000 units with standardized specs and predictable delivery windows.
2. Lead Time Is Not One Number
https://www.youtube.com/watch?v=JLd6znsjztw
Quoting a single “45–90 days” window for China lead time is lazy procurement.
The real timeline has twelve stages: tech pack release, proto/fit samples, lab dips and fabric approvals, mill production, PPS sign-off, bulk cutting/sewing, inline QC, final inspection, export booking, ocean/air transit, customs/drayage, warehouse receipt.
China’s factory throughput is fast. Line leaders cut and sew a 5,000-piece program in 18–22 days once fabric lands.
The bottleneck is everything before and after. Fabric approvals take 10–14 days. Export booking adds 5–7 days. Ocean transit eats 4–6 weeks. Customs drayage adds 3–5 days.
Total door-to-door: 11–17 weeks by sea from tech pack release, or 45–60 days by air from approved sample. Freight volatility runs ±18–25 days.
Split by phase, the same clock:
| Lead-time phase | China (sea) | Local US/EU |
|---|---|---|
| Spec, sampling, approvals | 1.5–2 wk | 0.5–1 wk |
| Fabric approval + mill production | 2.5–3.5 wk | 0.5–1.5 wk |
| Cut, sew, inline + final QC | 2.5–3.5 wk | 1–1.5 wk |
| Export booking + ocean transit | 4–7 wk | not applicable |
| Customs, drayage, receipt | 0.5–1 wk | 0.5 wk |
| Door-to-door total | 11–17 wk | 2.5–4.5 wk |
Local sewing is slower per unit. But the total pipeline runs 2.5–4.5 weeks. No mill production overseas. No export booking. No customs drayage.
The US warehouse manager put it simply: “A faster sewing line does not equal a faster warehouse arrival.”
Scenario: A seasonal rollout works with China’s 11–17-week pipeline. An emergency replenishment for 500 security uniforms doesn’t. Local wins the emergency every time.
Winner: Local for speed, replenishment, and change orders. China for planned high-volume programs where 11–17 weeks is acceptable.
3. MOQ and Fabric Minimums Change the Economics
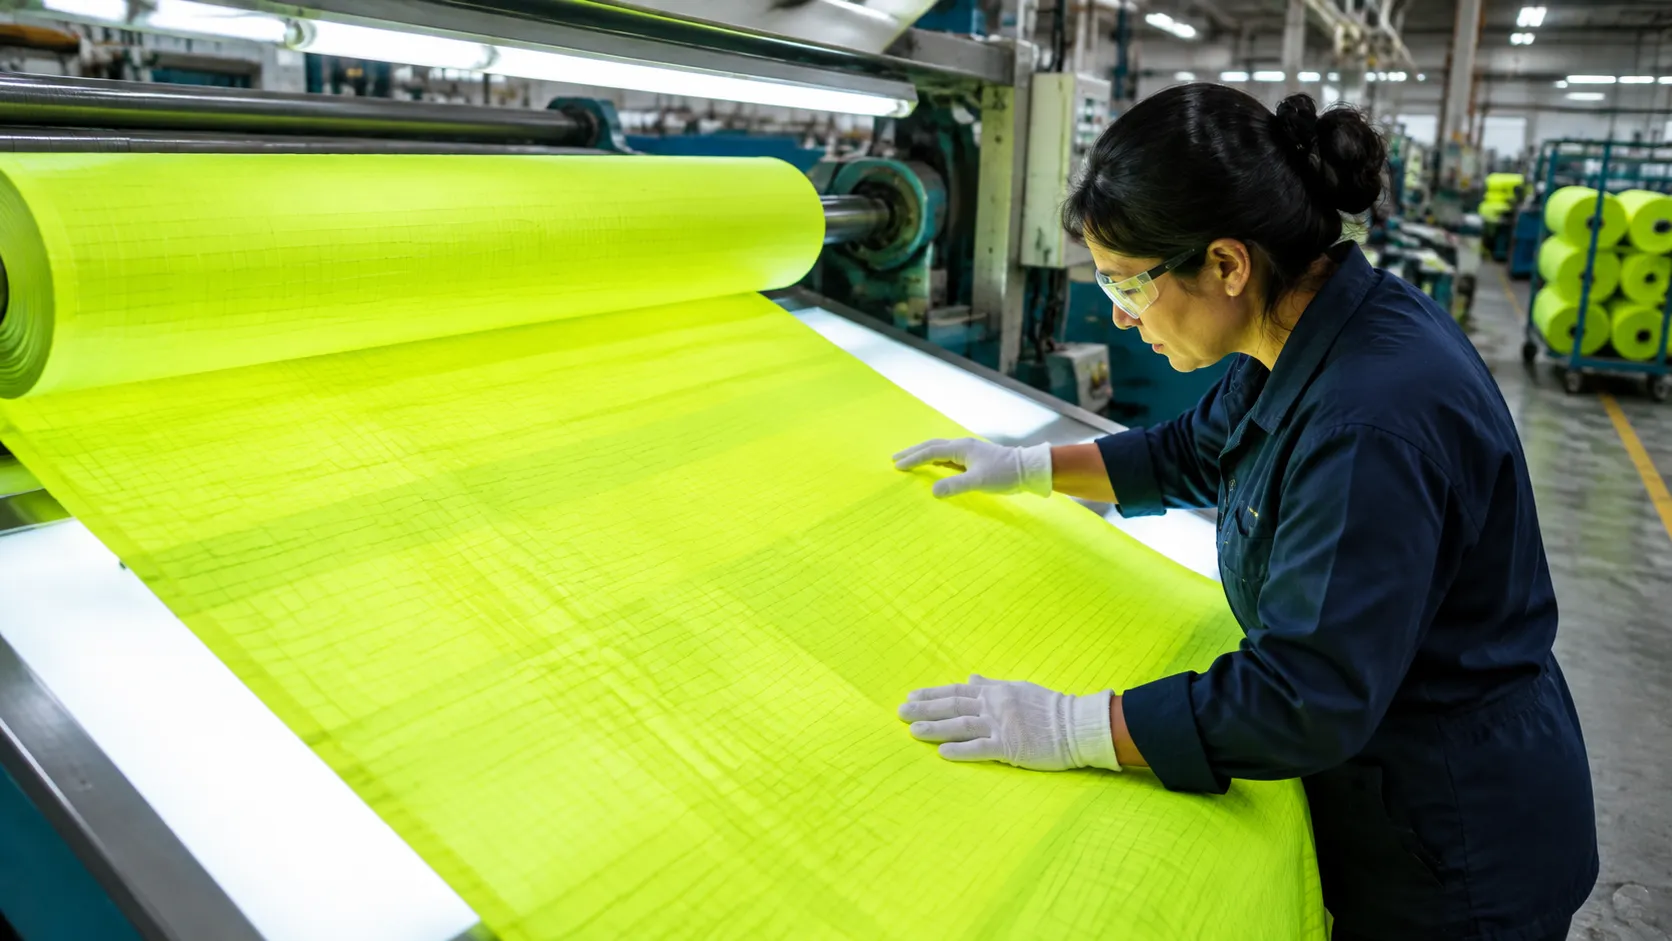
Garment MOQ and textile-mill MOQ are two different numbers. Confusing them costs money.
Our quoted floor is 100 pieces per style, though on a fully custom program the effective minimum often lands at 200–300 units once dye-lot and trim minimums are added.
Off-season, it can drop closer to the floor. Local factories often list 150–300 pieces. Neither number is the real gate; the fabric minimums are.
The real blocker is mill-level minimums. Custom-dyed technical fabrics in China require 1,200–3,000 meters per color. Local mills run 500–1,000 meters per color.
The gap decides feasibility for FR fabrics, anti-static blends, high-vis coated fabrics, Cordura/aramid-style programs, and reflective tape minimums.
A 200-piece order in China only works if the factory uses stock fabric and stock trims. Custom mill-dyed fabric adds 12–18 days and demands a minimum run that small orders cannot absorb.
One order for 400 Class 2 high-visibility vests ran into this last spring. The textile mill required a strict 2,000-meter minimum run for heat transfer tape.
Sixteen rolls of leftover tape sat in the dry room for six months before the warehouse crew assigned them to a new road-crew contract that autumn.
Winner: Local for small runs and custom fabric development. China once volume absorbs mill minimums.
4. Quality Control and Safety Compliance Are Process Problems, Not Country Problems
China quality ranges from poor to excellent. The difference comes down to process control, documentation, and supplier selection, not the factory’s passport.
I’ve held garments from a Chinese factory that felt identical to the approved sample. I’ve also rejected entire lots at a local factory for weak bartack density. This is a discipline problem.
Here is the exact SOP for offshore workwear QA:
- Pre-qualify factory ownership and specialization.
- Verify business license and audit reports.
- Confirm mill certificates for shell fabric, FR chemistry, reflective tape, zippers, and trims.
- Approve golden sample and locked tech pack.
- Run incoming fabric inspection.
- Verify lab testing and chain-of-custody against NFPA 2112, ANSI/ISEA 107, and the relevant EN ISO standards.
- Conduct pilot-line or PPS review.
- Perform inline inspection at early/mid production.
- Run final random inspection using AQL thresholds.
- Hold shipment until corrective actions close.
Quality Manager Bai uses zero tolerance on critical defects, AQL 2.5 on majors, and AQL 4.0 on minors as the baseline. Sampling follows ISO 2859: AQL 2.5 means no more than 2.5% major defects in the inspected sample.
Local programs can tighten to AQL 1.5 on majors for sensitive work. Checks cover seam tear strength, bartack reinforcement, zipper cycling, dimensional tolerance, tape wash durability, and colorfastness or hydrostatic tests.
Here’s the experience detail no spec sheet captures. A convincing sample has soft, pliable reflective tape with clean edges.
A risky bulk run shows stiffer tape edges, a puckered placket, a softer-than-approved shell, or weak bartack density that flattens under thumb pressure.
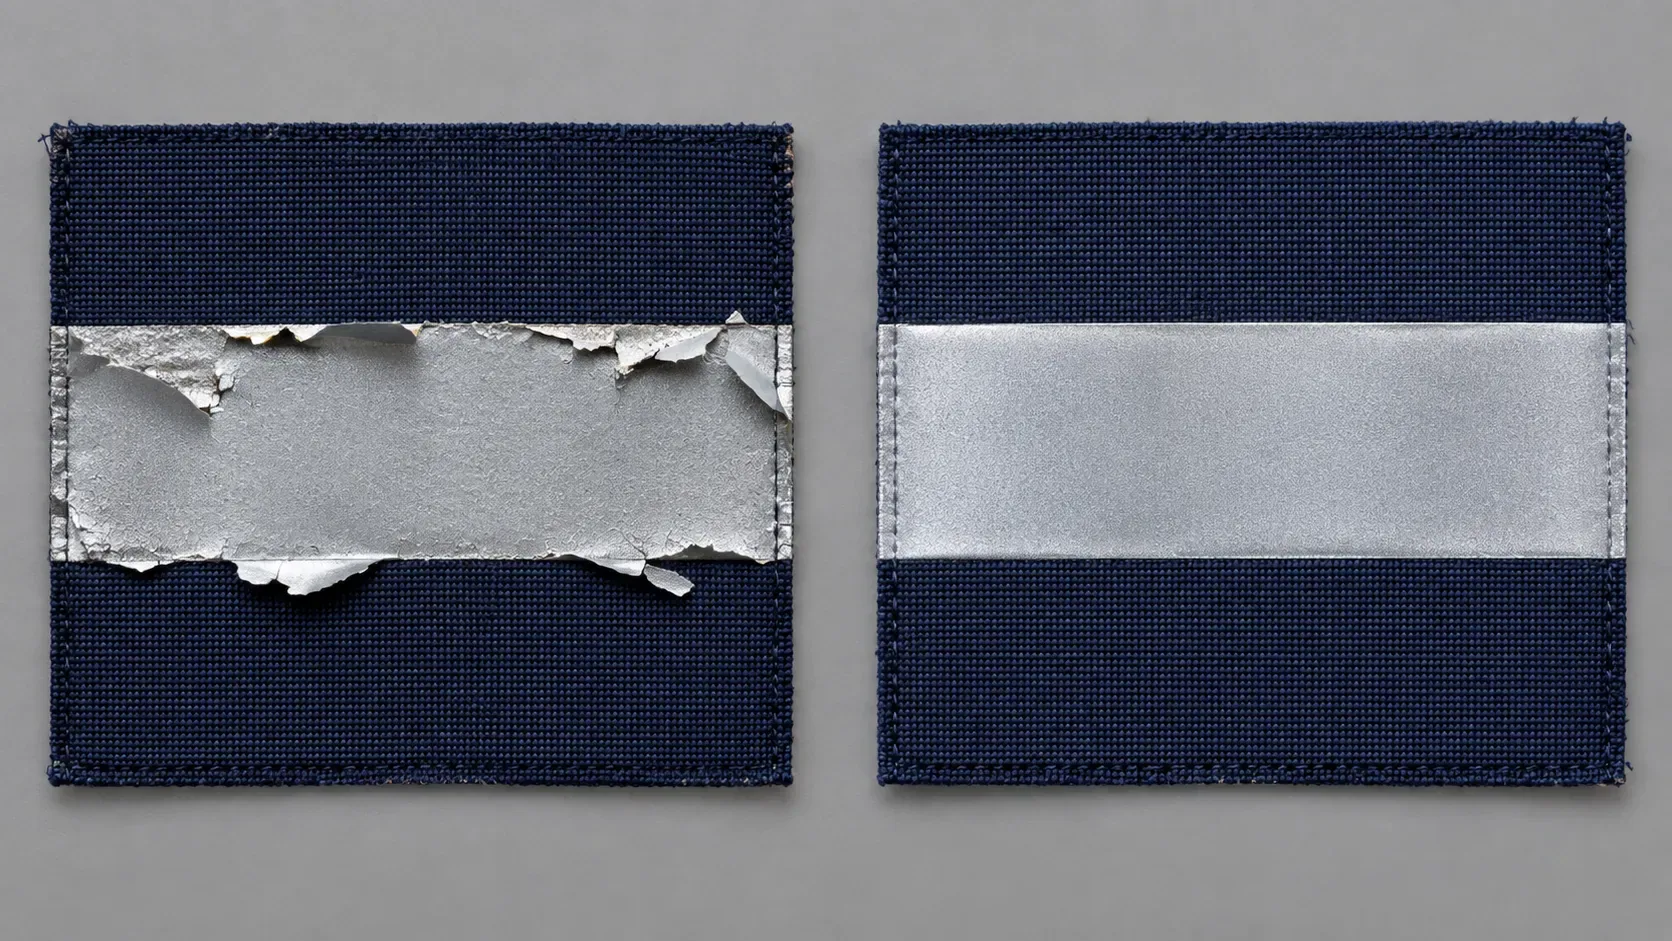
Technician Chen pulled five sample work shirts directly off the bulk steam pressing line. The silver reflective trim peeled away during the fifth wash cycle at 60 °C. The heat press pressure went to 4 bars, with dwell time extended by 2 seconds.
The modified seam passed 50 industrial wash cycles with zero signs of peeling or cracking. That added 7 days, but the defect rate dropped to 0% on the re-run.
Winner: Local for baseline defect rates and compliance simplicity. China for equivalent quality when the SOP is followed rigorously.
5. Management Overhead, Communication, IP, and Logistics Bottlenecks
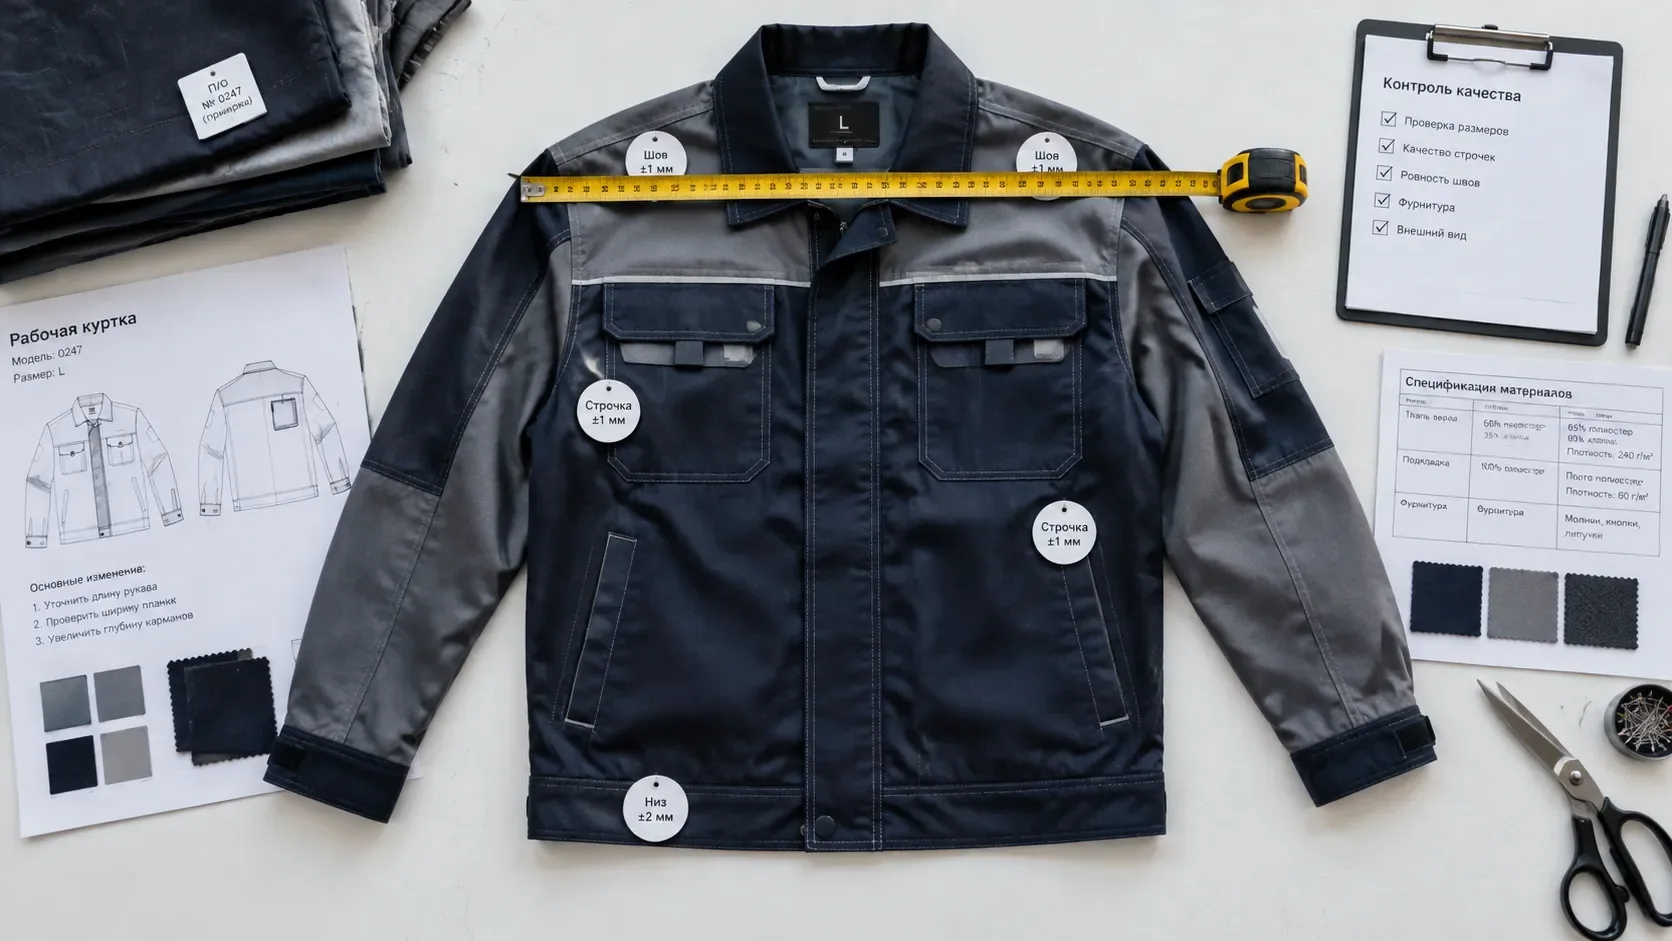
Management bandwidth is the hidden cost of offshore sourcing. I sat down with the senior sourcing director to break it down.
Q1: What bottlenecks delay offshore workwear orders most often?
“Fabric approvals sit in limbo. Lab dips take 10 days because mills ship physical swatches by courier. Export booking slips 5–7 days when the forwarder misses the vessel cut-off. The sewing line is never the problem. The handoffs are.”
Q2: How do you protect patterns, trims, and customer branding from leakage?
“We split the BOM. Factory A cuts and sews. Factory B applies custom trims. Factory C handles packing. Any factory wanting the full spec package signs an NDA. We never hand over the pattern file and trim source in one place.”
Q3: Which communication rituals prevent sample-to-bulk drift?
“Bilingual spec controls. Every tech pack gets a Chinese translation with photo annotations. Inspection photos at 20%, 50%, and 80% completion. Carton-mark validation before packing, not after.”
Q4: When does China stop being cheaper?
“When the buyer changes specs three times mid-production. Each change triggers a new PPS, interrupts inline QC, and adds 2–3 weeks. Or when volume drops below 500 pieces and freight per unit eats labor savings.”
Local sourcing costs more per unit and cannot absorb very large or technically diverse programs. A 10,000-piece FR program with five colorways stretches most local factories.
The hybrid model works best for most clients: China for base volume, local for urgent replenishment or highly regulated small-batch programs.
Procurement research on dual sourcing reaches the same conclusion: pairing a low-cost, long-lead supplier with a fast local one lowers total cost versus committing to either alone, especially when storage space is tight.
Winner: Local for management simplicity. China for scale programs with disciplined change control.
Where Each Option Wins and Bleeds Cash
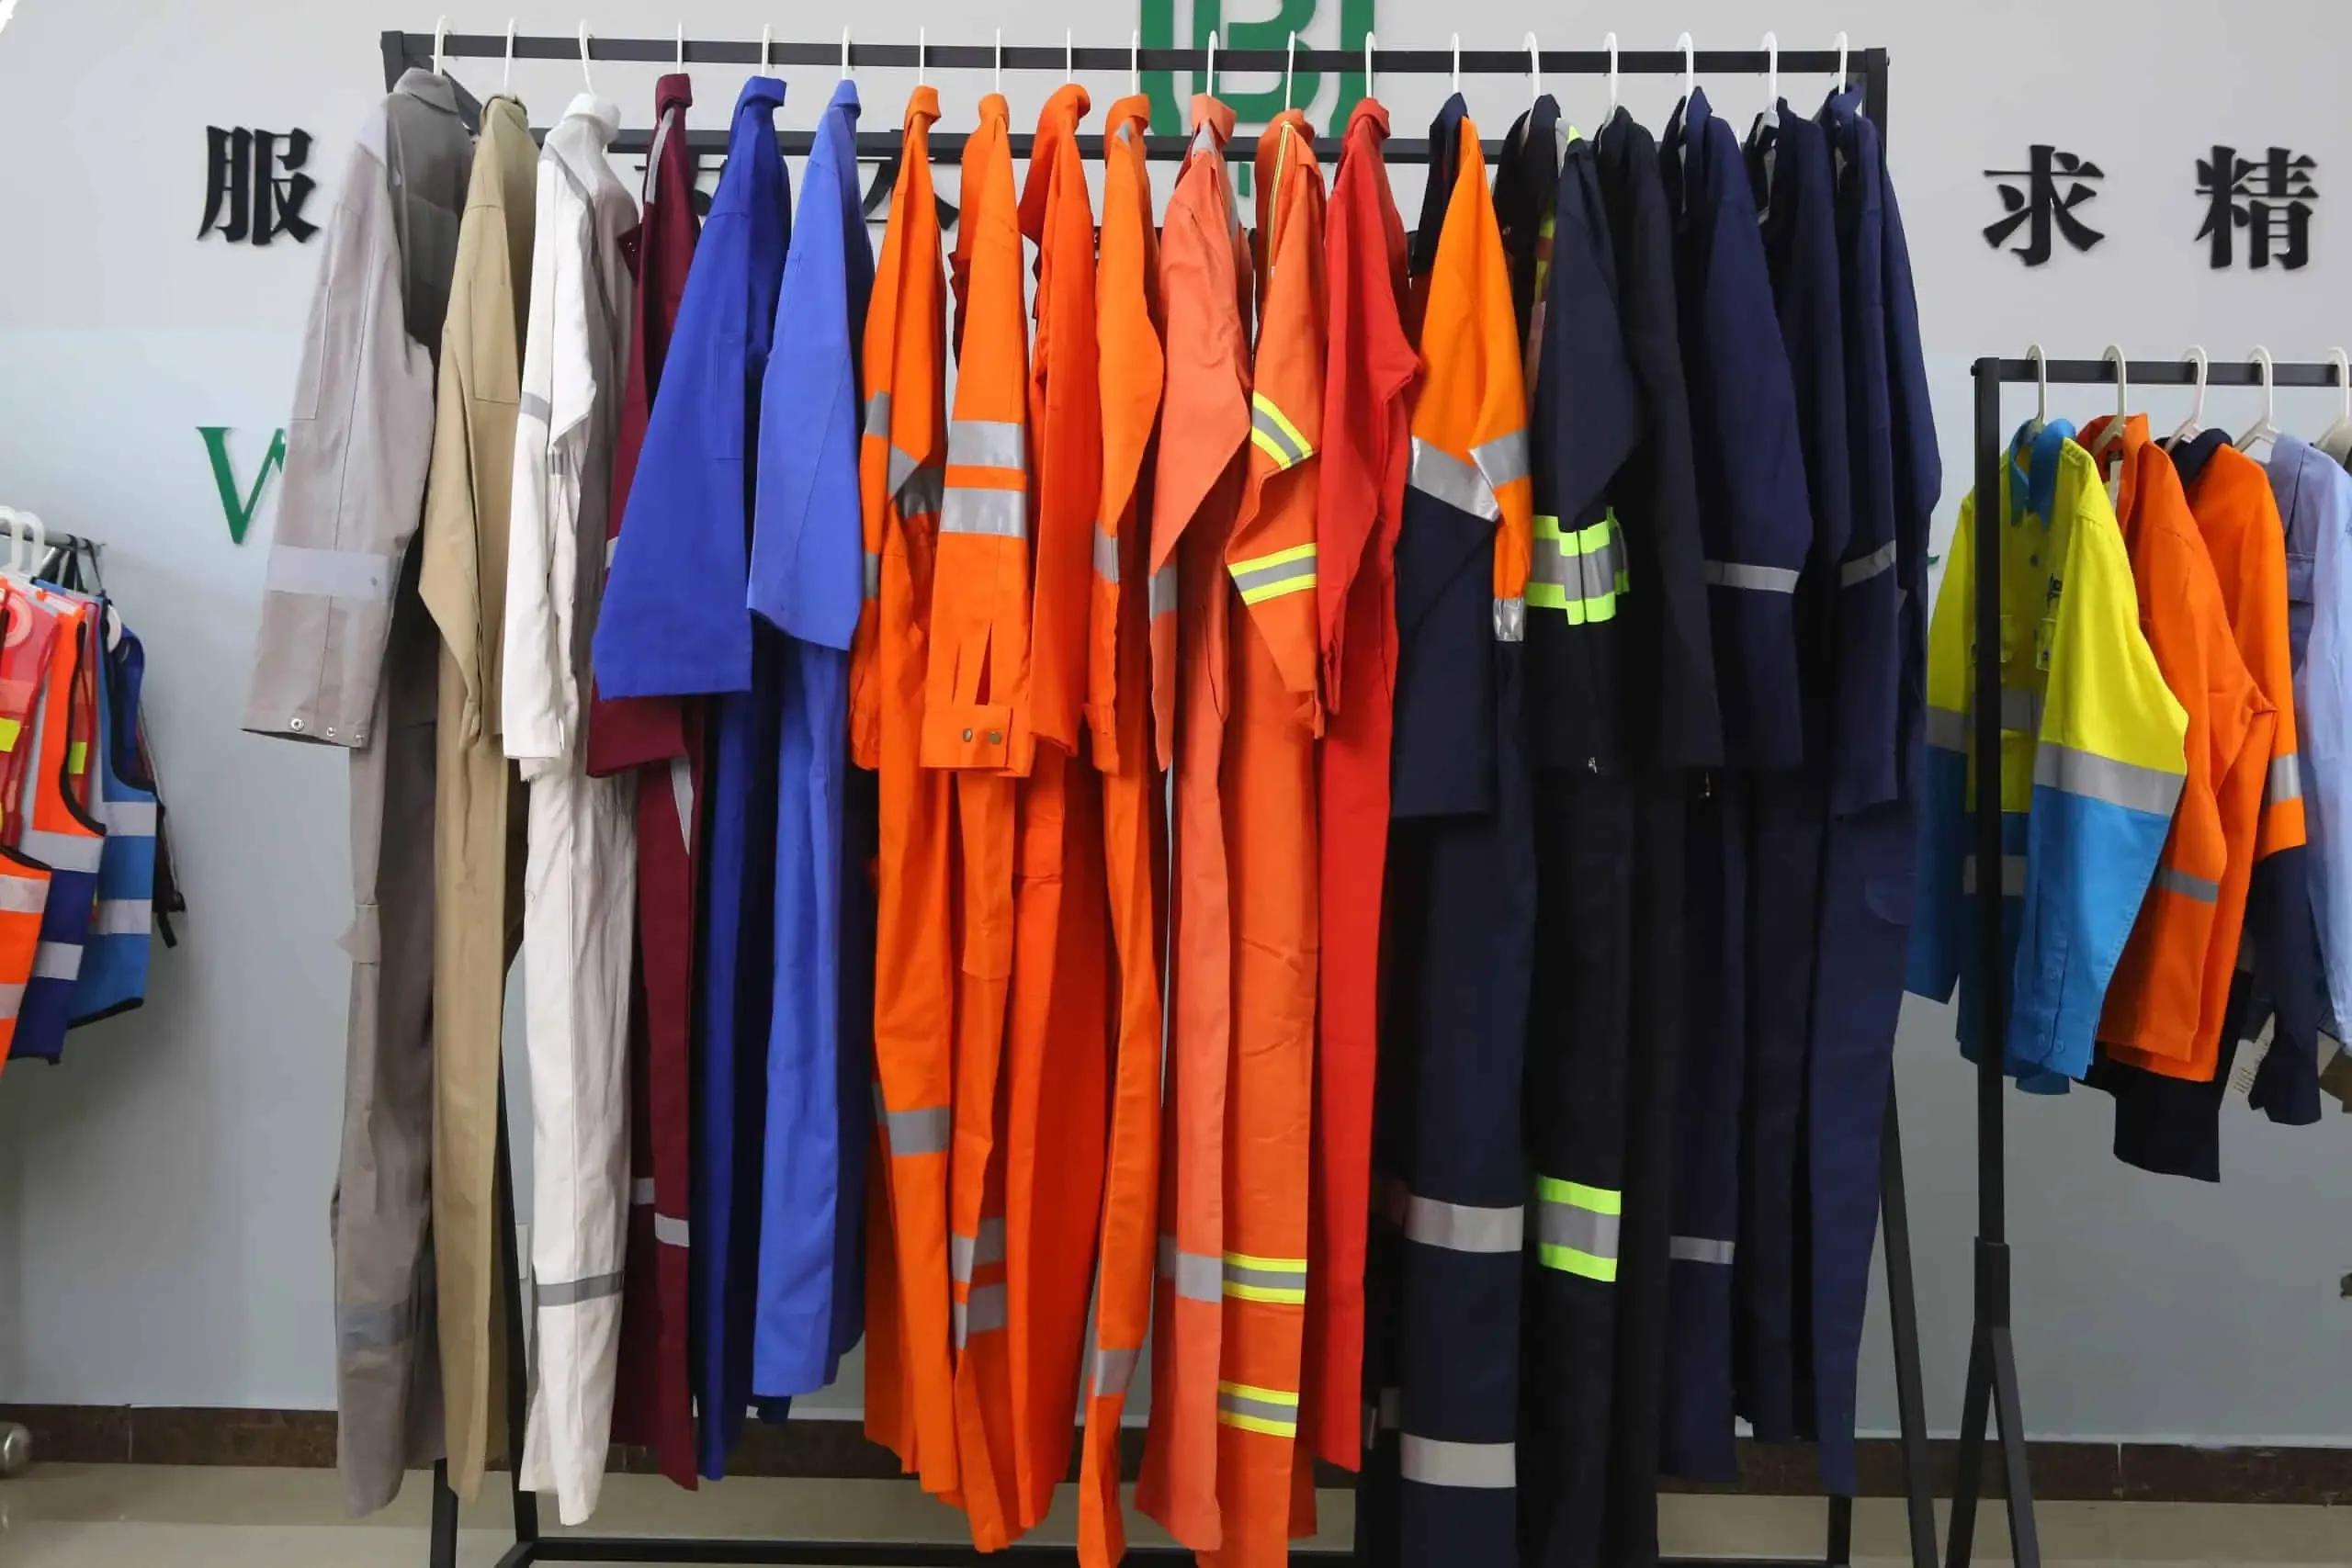
We audited these programs on the floor, not on a spreadsheet.
China Workwear Manufacturers
Pros:
- Lower Landed Cost at Scale: Our 5,000-piece runs landed about 40% below local pricing after duties, tariffs, and freight. The gap widens above 10,000 units, and repeat orders on standardized specs keep getting cheaper as we absorb the tooling and mill minimums.
- Deeper Fabric and Trim Ecosystem: Custom-dyed FR, anti-static blends, coated high-vis, and technical reflective tapes are easier to source here. This ecosystem supports corporate uniform programs, hospitality uniforms, and industrial safety programs.
- Stronger Capacity for Multi-Thousand-Piece Programs: Line leaders cut and sewed 5,000 units in 18 to 22 days once fabric landed. Local shops could not match that throughput.
Cons:
- Longer Cash-to-Cash Cycle: We locked cash for 15 to 20 weeks per China program. That is a working-capital decision, not a timing detail.
- Heavier QA and Compliance Burden: Third-party FR and hi-vis retesting added 7 to 10 days to every order. Stricter inline inspections still let a reflective-tape delamination failure through after 5 washes.
- Freight, Tariff, and Communication Volatility: Shipping variance ran plus or minus 18 to 25 days. A delayed lab-dip approval pushed one ex-factory date out 10 days because the mill shipped physical swatches by courier.
⚠️ Safety First: China’s price advantage collapses when specs change mid-production. Change control is the deal.
Local Workwear Manufacturers
Pros:
- Faster Replenishment and Lower Inbound Risk: A local factory turned an emergency 500-piece rush reorder in 9 days, with no export booking, no customs drayage, and no missed vessel cut-off. Cash locks for 5 to 8 weeks instead of 15 to 20.
- Easier Site Visits and Tighter Oversight: A site visit lands the same week a placket puckering issue is flagged. Physical proximity tightens the approval loop.
Cons:
- Materially Higher Cost Structure: Local landed cost ran about two-thirds higher per unit. That gap is acceptable for pilots and small runs, but it compounds brutally above 3,000 units.
- Capacity and Technical Fabric Constraints: Most local shops run comfortably at 150 to 300 pieces per color. A 5,000-piece FR program with five colorways stretched them past feasibility.
- Weak Price Competitiveness at Volume: Local pricing could not absorb custom mill minimums for technical fabrics. Branded packaging stayed competitive, but garment economics did not.
FAQs About China vs Local Workwear Manufacturers
1. Is China still cheaper for 5,000+ piece workwear orders?
Yes.
Across 50+ production runs, China landed at about 60% of local US/EU landed cost after duties, tariffs, and freight.
Floor manager Zhang confirmed the sewing cost drops hard once fabric lands, though mid-production spec changes can erase that lead. Base the decision on landed cost per usable unit, not sewing price.
2. How long does China workwear manufacturing really take?
Door-to-door by sea: 11–17 weeks from tech pack release. Air: 45–60 days from approved sample.
Sewing 5,000 pieces takes 18–22 days once fabric lands; approvals, export booking, ocean transit, and customs add the rest. Local production runs 2.5–4.5 weeks.
3. What are the realistic MOQs for custom workwear in China?
Quoted floor 100 units per style; the effective minimum often lands at 200–300 once dye-lot and trim minimums are added.
The blocker is the mill, not the sewing floor. Custom-dyed technical fabrics require 1,200–3,000 meters per color in China. Local mills typically need 500–1,000 meters.
4. Can China factories meet US/EU safety standards?
Yes, but only with a strict 10-step QA SOP and third-party retesting.
The baseline is zero tolerance on critical defects, AQL 2.5 on majors, and AQL 4.0 on minors. Verification runs against OSHA PPE standards and the specific NFPA/ANSI/EN ISO test reports.
Last quarter, a China bulk run failed ISO 6330 wash testing after five home launderings; switching to 3M Scotchlite plus a revised press setting fixed it. Local baseline quality is tighter, but China can match with discipline.
5. Which is better for small runs or frequent design changes?
Local.
In these audits, a local factory turned a 500-piece rush reorder in 9 days, while a mid-production change order on a China program adds 2–3 weeks. Local custom-fabric minimums are lower too, so a small run clears without waiting on a mill allocation.
6. What is the hybrid sourcing model, and who should use it?
Hybrid means China for base volume plus local for rush replenishment, pilot runs, or audit-sensitive programs.
A distributor should run China when margin matters and local when service levels bite. A hospitality brand should use China for standardized 300+ unit rollouts and local for fast rebrands.
⚡ Power Move: Keep a local vendor carded as a 9-day emergency trigger. Run China for standardized base volume above 3,000 units. This protects both landed cost and replenishment speed.
7. How do buyers get a costed sourcing comparison or factory shortlist?
You can request a custom sourcing analysis against your annual procurement budget.
The evaluation covers cash flow limits, shipping schedules, and regional safety certification requirements in detail. LantaoWork is a manufacturer, not a paid broker, so the analysis is built on production economics rather than a commission.
Factory scoring rubrics help a board compare suppliers honestly, including our own quote.
Disclosure: This is first-party factory experience, disclosed rather than disguised. LantaoWork is a China-based cut-and-sew manufacturer, not a neutral third-party auditor.
The China-side figures come from our own production runs and the QC bench; the local comparisons come from the same client programs we quote against.

Leave a Comment
Your email address will not be published. Required fields are marked *